When the tracking switched off
-
Snapshot
- Client
- Brighton & Hove Pride · Pride on the Park 2026
- Role
- Marketing & Social Media Manager (Mar to Sep 2026)
- Channels
- Paid social, email, SMS, organic social, artist and creator partnerships, PR, out of home
- Result
- 70,000 tickets sold at higher prices than the year before · £350k marketing budget

The brief
Sell two days of Pride on the Park, Brighton & Hove Pride’s 35th-anniversary festival, headlined by RAYE and Diana Ross, across a six-month campaign.
On paper, that’s a familiar festival job. In practice, Meta disabled the festival’s pixel, and the ticketing platform couldn’t show where buyers came from.
That left £160k of paid media with no reliable way to measure what it was selling.
The challenge wasn’t just selling tickets. It was knowing what was selling them.
The market read
Meta had disabled the festival’s pixel because it classified the website as sensitive due to its association with sexual orientation, so ticket sales never made it back to Ads Manager. The ticketing platform didn’t support UTMs either.
Most of the signals you’d normally use to steer a campaign were gone.
But one useful piece of data remained. Every ticket sold still came with a postcode.
The decision
So I stopped asking which ad sold a ticket, and started asking who wasn’t buying.
Every day I compared sales against campaign activity and historical data, using AI to help surface patterns across the different datasets.
Three months in, one stood out.
London sales were down 22% against the same point the previous year.
One of the festival’s biggest audiences outside Brighton was quietly slipping away, and nothing in Ads Manager would have shown us.
We shifted paid spend to target London directly.
Once the festival was over, I built a marketing mix dashboard bringing six data sources into one view, so the next campaign wouldn’t have to rebuild the picture from scratch.
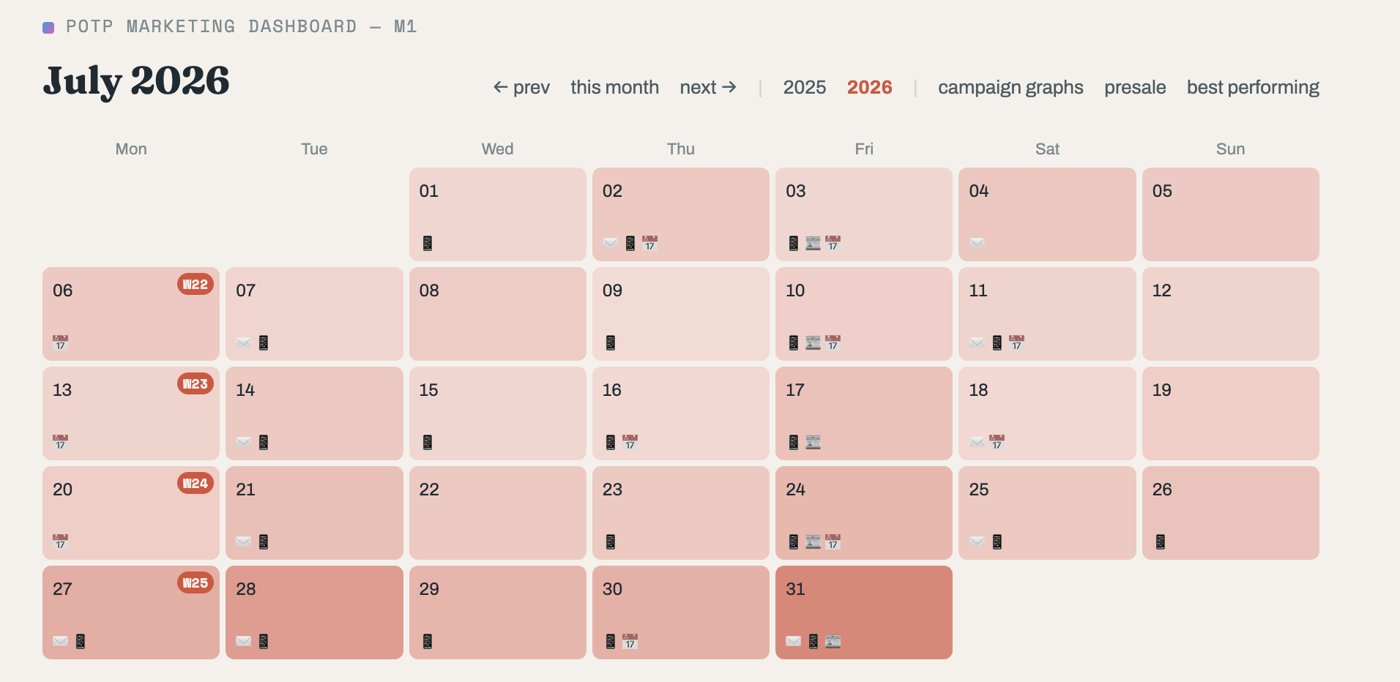
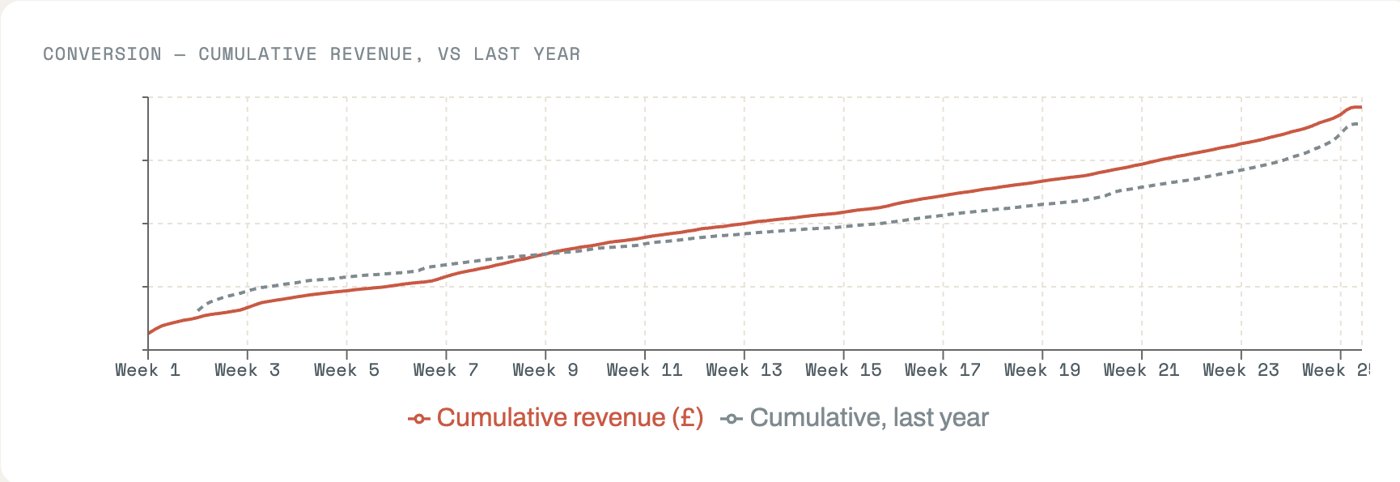
The marketing mix dashboard I designed and built after the festival, using the campaign’s historic data.
By breaking sales and Meta spend down by campaign day, the dashboard can compare performance against the same point in the previous year’s campaign, rather than against arbitrary calendar dates.
That creates the basis for an early warning system: campaigns running ahead or falling behind can be identified quickly, with alerts triggered when sales or media performance moves significantly above or below expectations.
The aim is to move the dashboard beyond reporting what happened, towards showing when action might be needed.


Results
70,000 tickets sold.
Higher ticket prices than the previous year.
Revenue increased, despite conventional conversion tracking being unavailable.
Hiring, or have a project in mind?
Email me →